Tutorial 8
With a rising interest in networks, flows and transnational interactions, historians will increasingly use maps to depict the circulation of goods, ideas, and people. This tutorial will show you how to show routes and itineraries on a QGIS map. There are many ways to do it, here’s our version. The example we will use is Percy and Mary Shelley’s journey from London to Switzerland in 1814, described in their travelogue History of a Six Weeks Tour (London, Hookham, 1817).
STEP 1: BUILD A CSV LIST WITH THE COMPLETE ITINERARY
Firstly I am building a CSV list which is made of all the points crossed by the Shelleys. The CSV file looks like this.
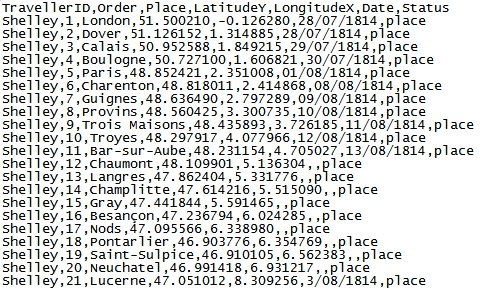
My CSV is composed of the following fields:
- TravellerID: you can opt for an ID number (1,2,3…) or a name. In this case we only have Shelley, but this will allow us to connect all the “Shelley” points together.
- Place and Date: these may of course be useful as labels or as additional information in the attribute table. As you can see, I was unable to get all the dates, as the travelogue tends to be unclear at times. Don’t forget to put an extra comma to show that your field is empty.
- Order: since we won’t be able to sort the itinerary by date, we need a simple way to classify our points in chronological order. A simple ranking from 1 upwards should work perfectly.
- Lat/Long: of course, like any point we have depicted in previous tutorials, you will need coordinates to precisely locate your points. These weren’t of course in Shelley’s travel account: a search on Google Maps allowed me to get the coordinates for each town.
- Status: this might be relevant for later. At the moment, all points are known as “place”, since they are places that the Shelleys crossed during their journey.
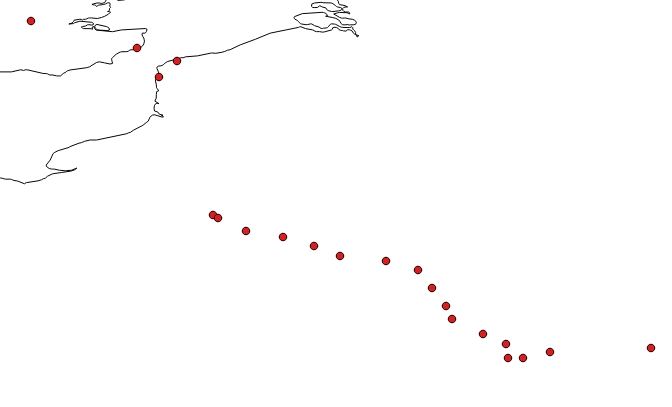
Once added to QGIS, all your points are disconnected.
STEP 2: CONNECTING YOUR DOTS WITH POINTS2ONE
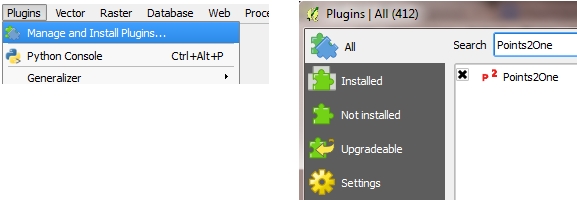
As stated previously, there are many ways to draw itineraries. Ours requires a plugin called Points2One. Open the Plugin Manager (Plugins > Manage and Install Plugins), look for Points2One and install it.
Once installed, open it via the Plugins menu or by finding Points2One’s icon ![]() in your toolbar. You should complete the Plugin as shown below.
in your toolbar. You should complete the Plugin as shown below.
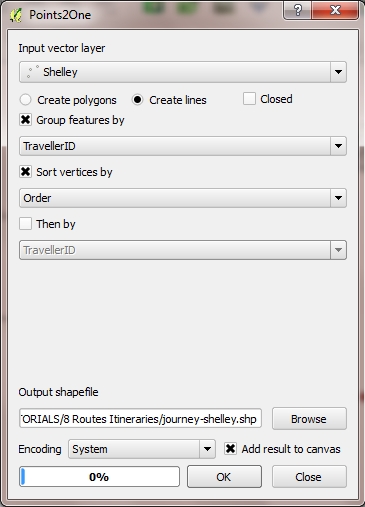 Input vector layer: the layer picturing your different points.
Create lines: here we only want one line rather than a polygon. If you want your last point to be linked to the first one, tick Closed. This itinerary will only go as far as Lucerne but the Shelleys did continue their tour through the Alps afterwards, therefore I will leave that box unticked.
Group features by TravellerID: this will allow the plugin to understand which points should be linked together. All the Shelley points will be, but this means that you can add more than one traveller’s itinerary in your CSV.
Sort vertices by Order: thanks to the Order field in our CSV list, the plugin will understand that it needs to connect 1 with 2, 2 with 3, and so on.
Do not forget to select a name for your new layer, and tick Add result to canvas if you wish to see the result directly.
Finally, click OK.
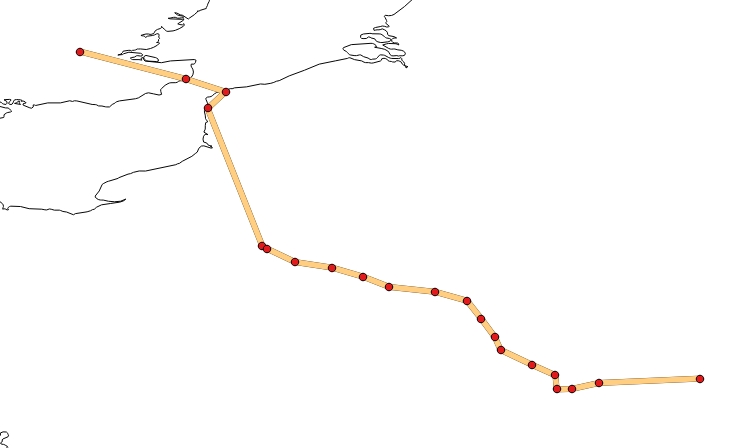
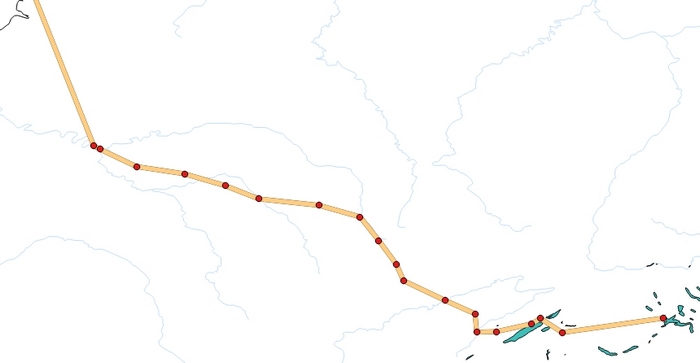
The final result, after changing the style of the line, looks like this.
STEP 3: THE ITINERARY CROSSES A LAKE!?
Of course, the route between each dot is a straight one, which is not very accurate. It might not be an issue at all for the general comprehension or accuracy of your map, but there might still be some adjustments to do.
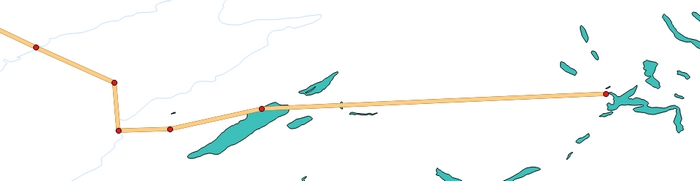
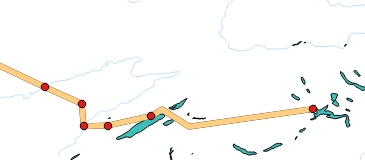
By adding natural elements to this map I realised that the final stretch of the Shelleys’ journey looks like it is crossing a lake.
In order to avoid this we would like to add points that will not be considered as visited towns, but which Points2One will still connect to the rest of the itinerary. I am therefore adding two points to my CSV list.
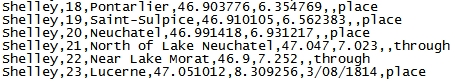
As you can see, I have added the status ‘through’ to those points, instead of ‘place’, because I don’t want my map to display those points – I will be able to filter that later. In the meantime, I am repeating the process in order to take my edits into account. Note: when this tutorial was written (June 2015) there was no “reload layer” function in QGIS. Forums show that many users would like that option to be added to the next version of QGIS, which would allow us to change our map quicker.
After adding the CSV points and drawing the itinerary line again, our map looks like this.
STEP 4: FILTERING POINTS AND ADDING LABELS
Finally, we want to do two things: hiding the two points that we created, since they were not feature in Shelley’s diary, and adding labels for the towns and cities crossed.
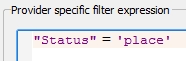
In order to hide the two ‘detour points’, open the point vector layer’s Properties. Under General, click on Query Builder. Now that you know how to perform queries, you know that we will filter the Status field so that only ‘Places’ are displayed.
As expected, the points have disappeared but they are still part of the drawn itinerary.
I am then adding labels for my dots. If you want to hide some of the small towns, you can always change the ‘Status’ of some of your points in your CSV (from ‘place’ to ‘through’).
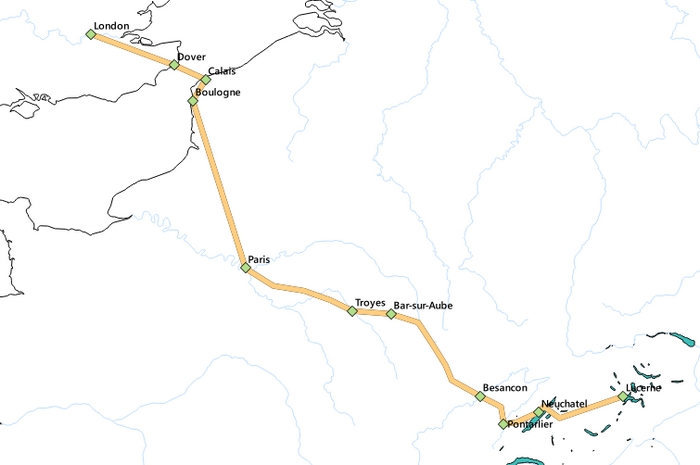
The final result (before adding other layers such as relief, political borders, etc), should look like this.
Last update: 8 June 2015 on QGIS 2.8.1 Wien.