Tutorial 6
So far we have seen ways to depict and show phenomena and trends on a map. As historians, this opens up many opportunities for every researcher’s project. This tutorial is about learning from your map and getting data you didn’t know was already there for you. Layers aren’t just lines and shapes: they contain different types of information that you may find useful. It is something we saw already with CSV lists: we could add any information we wanted in our CSV, but only the lat/long points would be displayed. Let’s learn how to make the most out of your shapefiles.
We will use the communes (towns) and départements (districts) of France as a case study.
STEP 1: GETTING FAMILIAR WITH ATTRIBUTE TABLES
I have added a coastline base layer and downloaded territorial data from the French governmental IGN Données website.
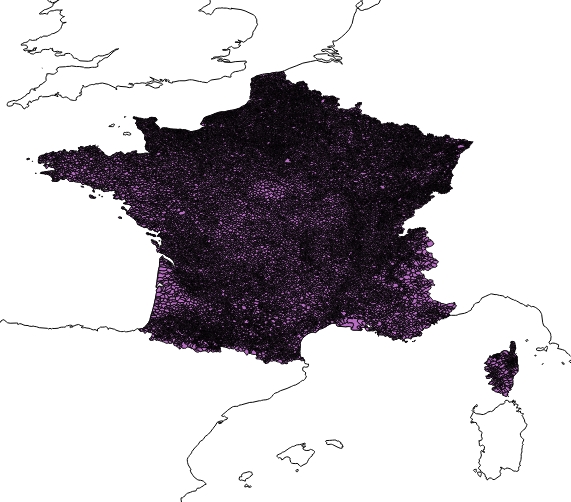
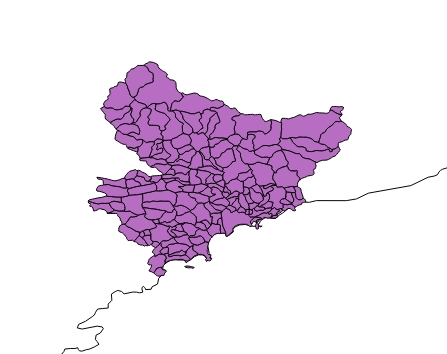
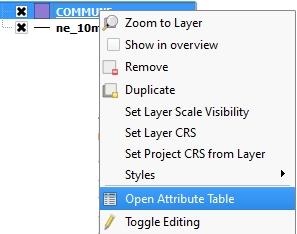 The map which is displayed here features 36,595 towns. As we said before, this layer is not just showing them – it has a detailed list of their names as well as other data. To see this, we need to access the attribute table. To do so, right click on the name of the layer and choose Open Attribute Table.
As you can see, the table precisely lists each town’s name, postcode, lat/long, area, population, and the département and région it is part of. In other words, this is way more than what the map seemed to show!
STEP 2: FILTERING YOUR LAYER
The attribute table is great to access more information, but this sometimes needs to be filtered in order to only keep what is necessary. You can do so through the attribute table but this tutorial is going to show you a quicker way to filter your layer.
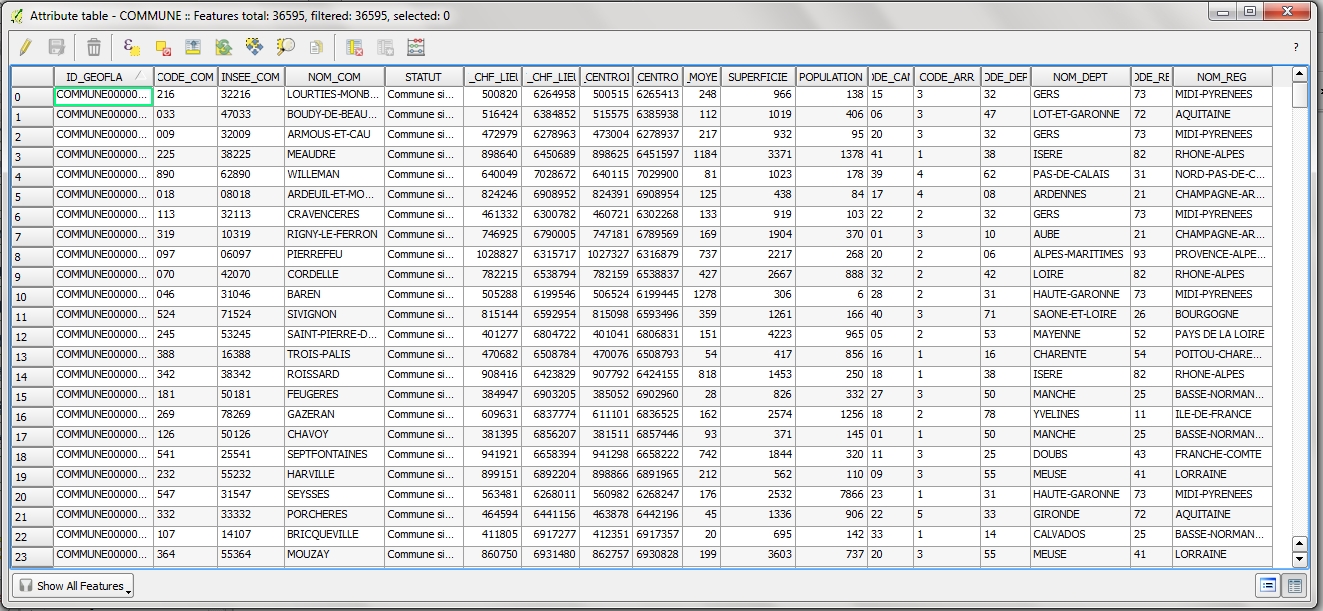
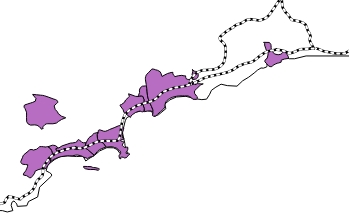
We want to focus on the French Riviera, on the south-eastern coast of France. More precisely I would like to only display the towns located in the département (district) of Alpes-Maritimes.
Close your attribute table and right click again on your layer name, and choose Filter. This part of the process is a bit tedious. In the window that just opened you will need to insert an expression. Expressions are similar to mathematical formulas.
In the left column, you will find all the fields that you previously saw in the attribute table. Here we want to filter by district name, therefore we are selecting NOM_DEPT and by clicking on All in the right column, all the different district names appear. You can now easily build your expression by double clicking on each of its elements. Therefore, as you only the towns located in the Alpes-Maritimes district to appear, your expression should be as follows:
![]()
Click on OK. The map is now only showing the communes of the département of Alpes-Maritimes, but you will always have the option of re-adding some other parts of the layer by changing your formula.
STEP 3: FILTERING YOUR ATTRIBUTE TABLE BY DATA
Now that we have selected this département, we would like to only show the towns which have a population higher than 20,000. This is a choice we are making for this tutorial. Step 2 and Step 3 can of course be done independently from each other.
Back in the Filter option, we are repeating the same process, by operating a new query. The previous formula will still be there, you need to add the “POPULATION” > 20000 one afterwards. Both should be separated by AND which is necessary in order to take both conditions under consideration.
![]()
We now have gone from over 36,000 towns to only 10.
Final result with railways added to the map
MORE THAN ONE QUERY ON THE SAME SHAPEFILE?
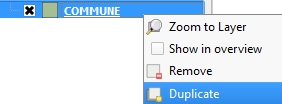 Should you want to filter two different elements of one single shapefile (e.g. two groups of French communes), and deal with them separately, you may duplicate your layer and perform different queries on each of them. To duplicate a layer, right click on its name and click on duplicate.
One step further: creating a new layer out of a query
Last update: 1 June 2015 on QGIS 2.8.1 Wien.