Tutorial 2
Now that you have a map, you would like to show particular points on it. This is where Point Vector Layers will be useful. In this tutorial we will try to depict 6 European cities that were particularly important in the Grand Tour.
STEP 1: FINDING COORDINATES FOR THE POINTS WE WANT
There are different ways to find out what the coordinates of the place you want to depict are. In the case of our Grand Tour example, we want to show the following cities: London, Paris, Vienna, Geneva, Venice, and Florence.
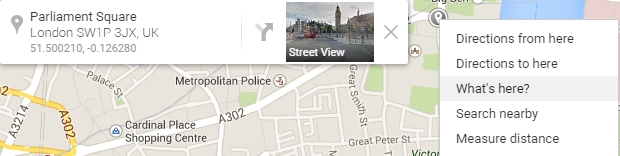
Google Maps is a very convenient way to get these coordinates. Right click on any point on Google Maps and choose What’s here?. This will give you the coordinates of the place, as shown on the photo.
For specific areas or sites, Wikipedia offers exact coordinates in the top right corner of the page. Florence’s Duomo, for instance, will appear with North and East coordinates.
STEP 2: MAKING A CSV IN A TEXT DOCUMENT
Now we want to list all our points in one place. To do so, we will be creating a CSV (comma-separated values) list. This will not be done on QGIS. Any text software can be used, such as:
- on PCs: Notepad or Notepad++
- on Mac: TextEdit (be sure to choose Make Plain Text from the Format menu) or TextWrangler
1. Start by defining what your fields will be, and separate them with a comma. In our case, this will remain rather simple.
City,Latitude,Longitude
2. You may start your list on the second line. Each entry must be separated by a single line break.
Note: in QGIS, a positive latitude value is North of the Equator, while a negative one is South. A positive longitude is East of the Greenwich Meridian Line and a negative one is West.
Our full list will then be:
City,Latitude,Longitude
London,51.500210,-0.126280
Paris,48.852421,2.351008
Vienna,48.211534,16.384351
Geneva,46.205327,6.139969
Venice,45.438171,12.334102
Florence,43.769019,11.250152
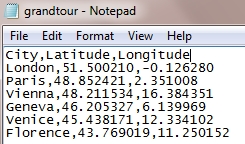
3. Save the file under a .csv extension (using Save as). Let’s name it grandtour.csv.
Your file should look like this and is ready to be inserted into QGIS.
STEP 3: IMPORTING A CSV INTO QGIS
To be inserted into QGIS, always keep in mind that a CSV must contain at least longitude and latitude values.
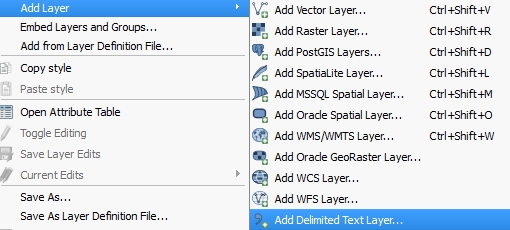
In QGIS, insert the CSV by clicking on Layer, Add Layer then Add Delimited Text Layer.
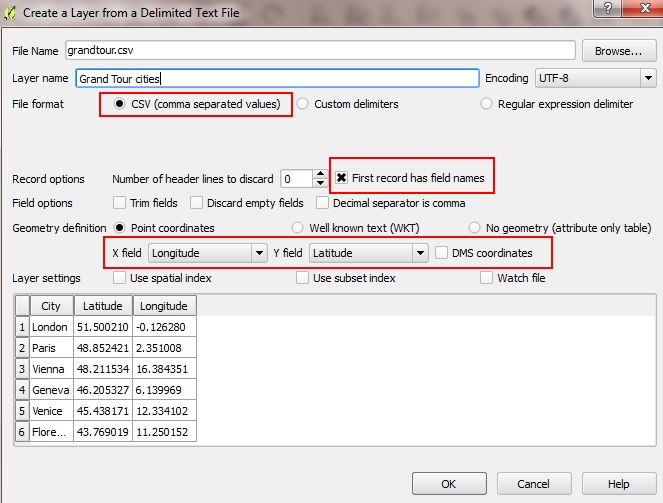
The box that just opened should look like this and be filled in as shown: under File Name, browse through your computer to find your CSV file. You may change the name of your layer, such as Grand Tour cities. Make sure to choose CSV under File format. Tick the First record has field names box so your first line is not considered as a value. Finally, you need to indicate which of your values will be the X (horizontal) and Y (vertical) so QGIS can understand the logic of the CSV file. X is the longitude (West/East) while Y is the latitude (North/South). You also need to untick the DMS coordinates box.
One more box just opened. You need to select a CRS. Select WGS 84 (the Authority ID is EPSG:4326) then click on OK.
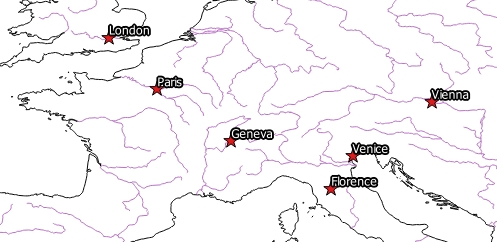
You finally have a map with the cities shown on it. By zooming on Europe, your map should look like this.
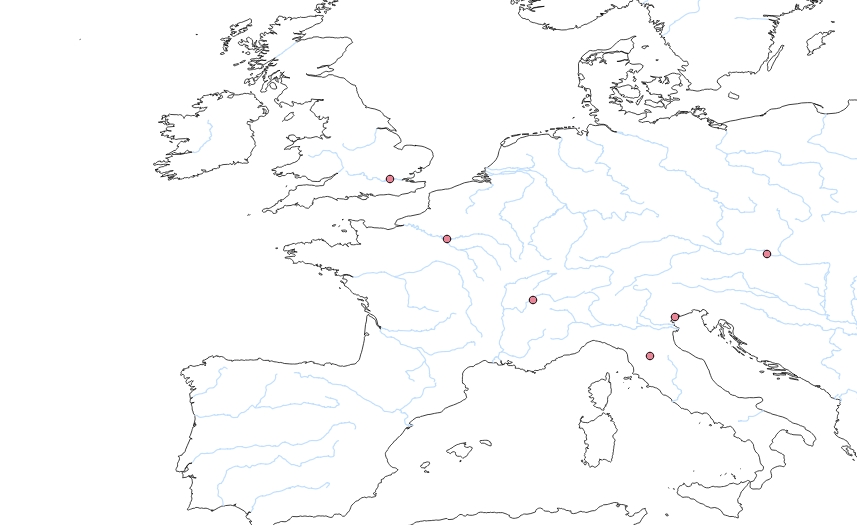
In this map only coastline and river layers have been kept in addition to our Grand Tour cities. Your map may look somewhat different if you have other layers activated.
STEP 4: CHANGING THE STYLE OF THE POINTS
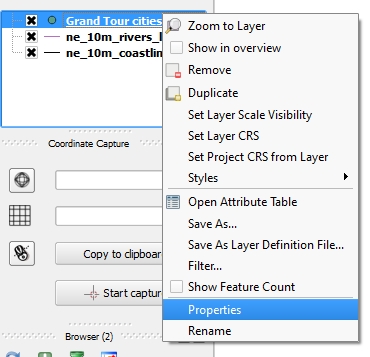
Like the base layers in our first lesson, we can edit the style of our Point Vector Layers. To do so, right click on the layer in the Layers list, and choose Properties.
Under Style, you can choose from a wide range of colours, widths, shapes, etc. As I am planning to create a more complex map later on, I want my six cities to stand out: I will opt for red stars.
STEP 5: FORMATTING AND LABELLING
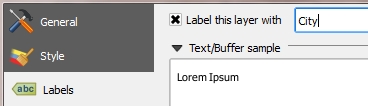
Finally, like in most maps, we would like to show the labels for each of our cities (e.g. Showing “London” next to the point depicting the city). To do so, style in the Properties menu, click on Labels. By ticking the Label this layer with you can choose which of the fields of your CSV file will be displayed as a label. In this case of course, we want the City entry to be displayed.
Further down in the same menu, you may also change the style (font, size, colour) of your label.
If you want to see what your labels look like whilst keeping formatting them, you can click on Apply rather OK. The menu won’t close but you will be able to see the changes you’ve just made.
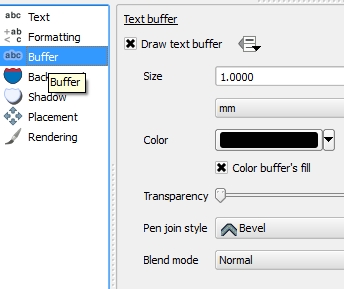
Now we would like to add a buffer around your text. A buffer is a sort of halo around your text: it will be very useful if your map is quite dark and if you want ensure that your label is still visible. Under “Buffer”, you can choose what kind of buffer you want. In the case of my map, as it is quite white, I would like a black buffer with a white text in the middle. I previously selected a white colour in the Text formatting section, and now I am choosing a black buffer.
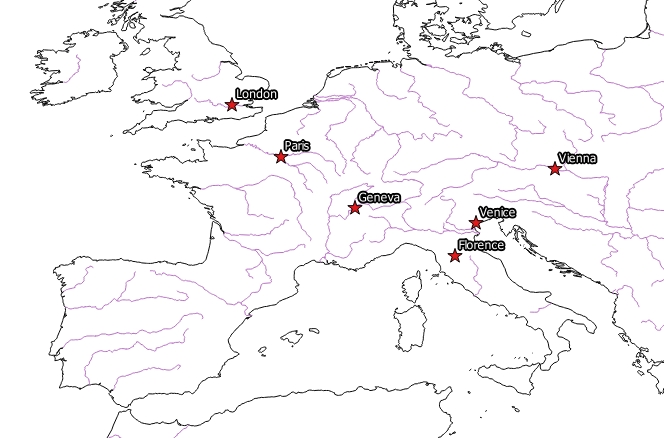
So far my map looks like this:
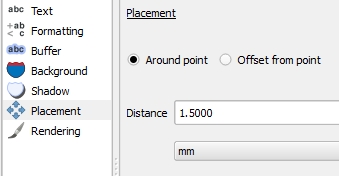
There’s one final change to be made. As you can see the labels are not ideally placed. They are a bit over the stars and some of them hide the rivers that run through the cities. This can be done in the Placement subsection of the Labels menu. In our case, we just need to put the labels slightly further away from the dot.
Around the dot only allows you to move closer or further away. Under Offset from Point, you can choose where your label should be placed in relation to the dot. In my case, I am satisfied with the following display:
Tip: you may not need such an elaborated map. Google Maps or Google Earth could deliver this equally well, depending on the needs of your project. Please read the excellent tutorials by The Programming Historian on that matter.
One step further: more icons and labels to download
Last update: 21 May 2015 on QGIS 2.8.1 Wien