Monday Session: Trading Consequences
Uta Hinrichs will join us to talk about Trading Consequences on Monday afternoon about 16:30. Read more in her original posting here.
As part of the session I will talk about two visualizations that we have built to explore how information visualization can be used to help environmental historians explore large collections of historic records along different perspectives such as geographic location, time, and context.
Both visualizations are based on several historic document collections that make up more than 170.000 documents in total. Commodity and location terms have been automatically extracted from these documents using text mining methods.
Links to both visualizations are listed below. You can use them to explore certain commodities of interest, e.g., sugar, coffee, or tea and see how these commodities were discussed in relation to certain geographic locations and in relation to other commodities.
The two visualizations to explore prior to the workshop can be found here (open these links in the Chrome Browser):
http://tcqdev.edina.ac.uk/vis/tradConVis/
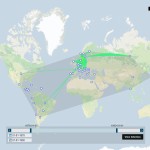
An interlinked visualization that provides an overview of how certain commodities were discussed between 1750 and 1950 along geographical and temporal dimensions. Click here for more details and instructions.
http://tcqdev.edina.ac.uk/vis/locationCloud/
A more text-based visualization, the LocationCloud, that shows the connections between a selected commodity, e.g., “coffee” to different geographic locations worldwide and how these have changed over time. Type in a commodity of interest and explore the geographic contexts in which it has been discussed over time. Click here for more details and instructions.
IMPORTANT
The visualizations only work in the Chrome Browser. You can download it here:
https://www.google.com/intl/en/chrome/browser/
Both visualizations are research prototypes and can react slow at times. Some patience is required.
For comparison, you can also try out our more traditional search interface and think about the strengths and limitations of these different approaches of representing the same data set of historic documents:
http://tcqdev.edina.ac.uk/search/commodity/
The visualization were built as part of the Trading Consequences Project, a collaboration between Environmental Historians at York University and University of Saskatchewan, Researchers in Text Mining and Language Processing in the School of Informatics at the University of Edinburgh, software engineers from EDINA, and Information Visualization researchers at the University of St Andrews.
 Next Post